October 2023
New: WA 278 HyLogger-3 holes
Holes currently on CorStruth
| HyLogger-3 | HyLogger-2 | Updated | |
| WA | 1604 | 38 | Oct. 2023 |
| SA | 849 | 442 | Sept. 2022 |
| NT | 560 | 50 | Oct. 2022 |
| Qld | 361 | 76 | March 2022 |
| NSW | 566 | 67 | Aug 2022 |
| Vic. | 77 | 0 | ----------- |
| Tas. | 390 | 104 | March 2023 |
| TOTAL | 4408 | 774 |
The current CorStruth products are:
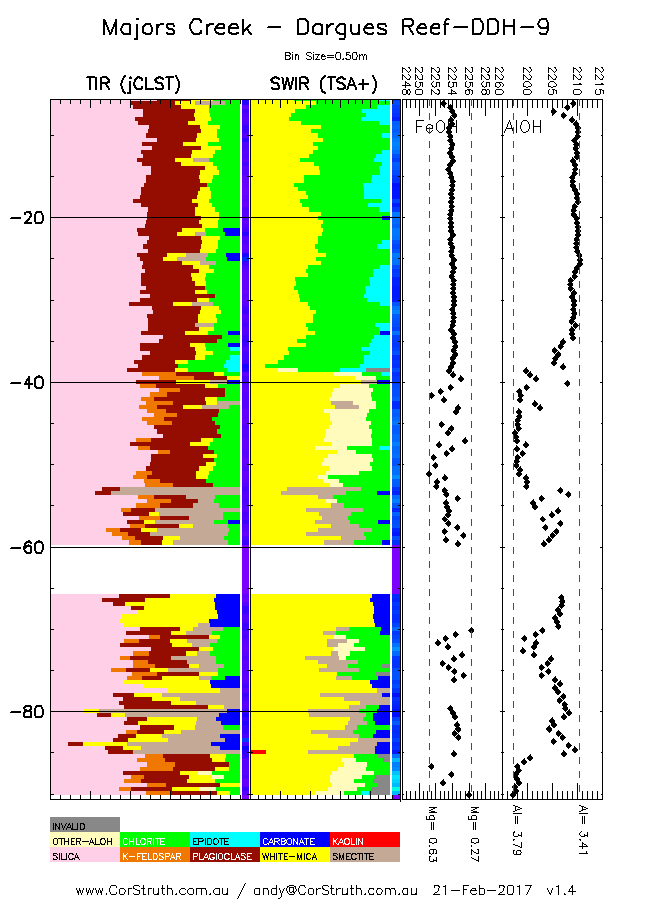
Interpretations (like the one opposite) suitable for A4 presentation with variable bin sizes.
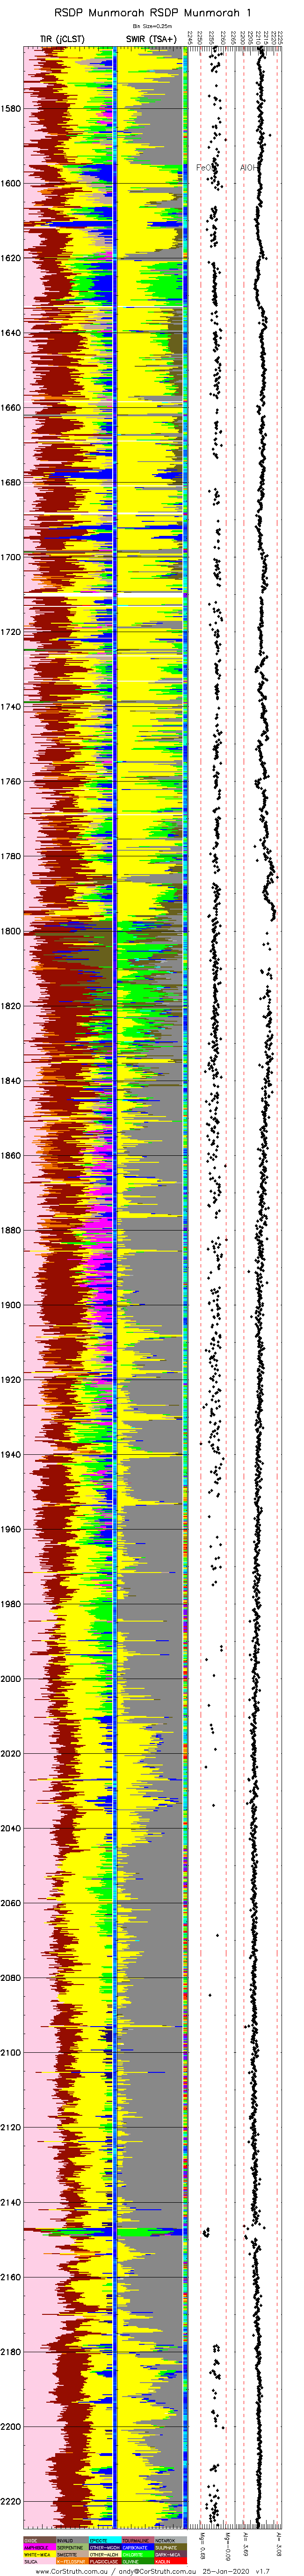
Browser-based scrollable images with a standard bin size of 0.25 m. (e.g. here)
Downloadable CSV files of TSA+ and jCLST interpretations binned at 1 m intervals.
Mineral Occurrence Maps (MOMA's) of various minerals identified with the NVCL data
Notes (sometimes wonkish) on items of possible interest for NVCL users (index here)
There are three ways to access the interpretation images...more
- Direct links for .... Tasmania, NSW, Northern Territory, Victoria, Queensland , South Australia, WA
- Google Maps Display
- Links in a Downloadable Spreadsheet
CorStruth's purpose is to provide automatic interpretations of the HyLogging data from every dataset acquired as part of the AuScope National Virtual Core Library (NVCL) program. The results are free for you to copy but remember that they have been produced by automatic algorithms which will make mistakes. In this regard make sure you read the notes under Cautions.
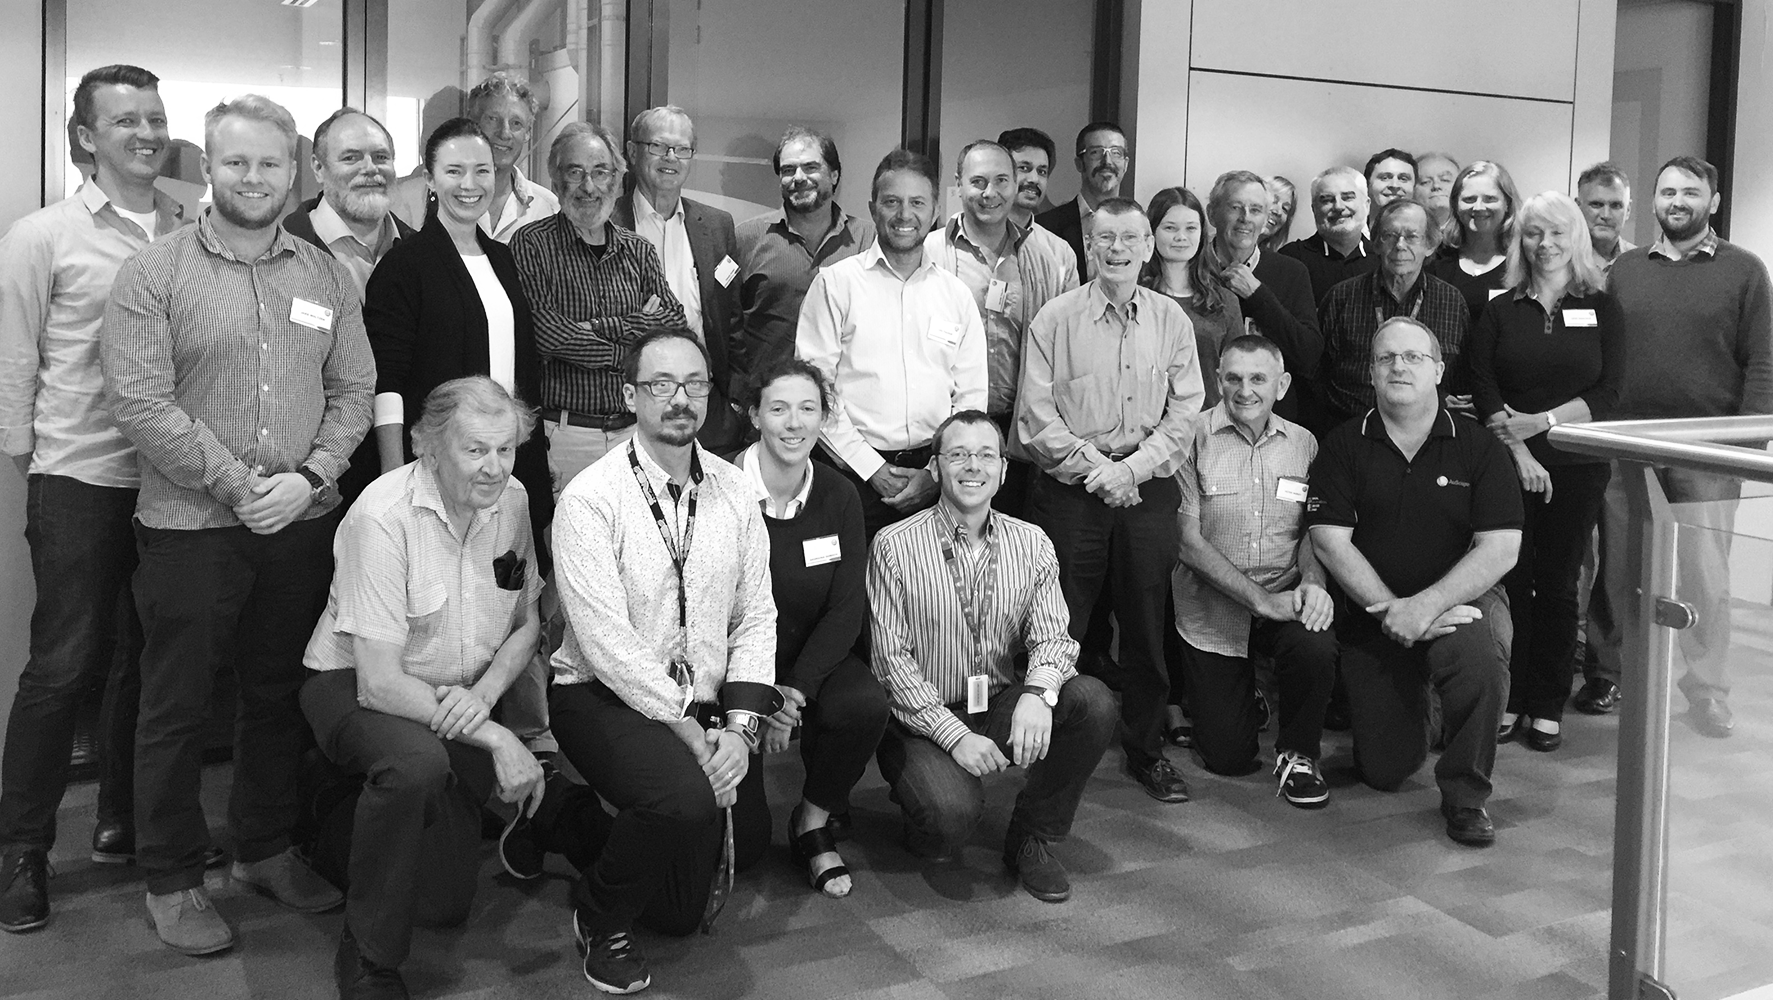
The NVCL program is a team effort and thanks are due to everyone involved - both individuals and organizations. And here most of them are at the 2017 NVCL Workshop in Sydney.
- Andy Green
Useful information